Home| imagery |src.lib|szamap| SZAMap Index

SZAMap

Syntax
float *SZAMap(int yr,int mo,int dy,int hr,int mt,int sc, int wdt,int hgt,int mode, int (*trf)(int ssze,void *src,int dsze, void *dst,void *data), void *data);
Header
imagery/szamap.h
Library
szamap
Description

The SZAMap function generates a rectangular grid of Solar Zenith angles for the map projection specified.

The date and time at which to calculate the terminator is given by the arguments yr, mo, dy, hr, mt, and sc.

The width and height of the grid are given by the arguments wdt and hgt.

The argument mode indicates whether geographic or geomagnetic coordinates are use. A value of zero will produce a polygon in geographic coordinates and a a value of (1) will produce one in geomagnetic coordinates.

The argument trnf is a pointer to a function of the form:

int (*trnf) (int ssze,void *src,int dsze,void *dst,void *dptr);

This function performs the transformation of the map projection.

The size in bytes of the input coordinate is given be the argument ssze. The coordinate data is pointed to by the argument src. The first two elements stored in the coordinate data block are assumed to be single precision floating point numbers of type float that represent the actual latitude and longitude of the point to transform.

The size in bytes of the output coordinate is given be the argument dsze. The coordinate data is pointed to by the argument dst. The first two elements stored in the coordinate data block are assumed to be single precision floating point numbers of type float that represent the cartesian coordinate that results from the transformation. The range of the cartesian coordinates should be zero to (1).

The transformation should read the coordinate from src, transform it and write the value to dst.

The data argument of the SZAMap function is passed directly as the dptr argument of the transform and allows extra parameters to be passed to the function.

The function should return a zero if the transformation was successfully applied or (-1) if an error occurred.

The SZAMap function allocates a memory buffer containing a two-dimensional array of floating point numbers of size equal to the width and height arguments. This array is used to store the calculated solar zenith angles. For coordinates that are not on the globe, the value stored in the array is set to (-400).

Returns
Returns a pointer to a two-dimensional array containing the solar zenith angles. On error a NULL pointer is returned.
Errors
On error a NULL pointer is returned.
Example


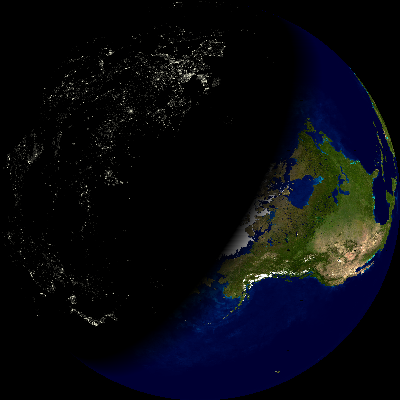
Source Code: SZAMap.c

/* SZAMap.c
   ========
   Author: R.J.Barnes
 Copyright (c) 2012 The Johns Hopkins University/Applied Physics Laboratory

This file is part of the Radar Software Toolkit (RST).

RST is free software: you can redistribute it and/or modify
it under the terms of the GNU General Public License as published by
the Free Software Foundation, either version 3 of the License, or
(at your option) any later version.

This program is distributed in the hope that it will be useful,
but WITHOUT ANY WARRANTY; without even the implied warranty of
MERCHANTABILITY or FITNESS FOR A PARTICULAR PURPOSE. See the
GNU General Public License for more details.

You should have received a copy of the GNU General Public License
along with this program. If not, see <https://www.gnu.org/licenses/>.

Modifications:

*/


#include <stdio.h>
#include <stdlib.h>
#include "rtypes.h"
#include "rxml.h"
#include "option.h"
#include "rfbuffer.h"
#include "rplot.h"
#include "rtime.h"
#include "polygon.h"
#include "rmap.h"
#include "gmap.h"
#include "sza.h"
#include "szamap.h"

float *zenith;

int stream(char *buf,int sze,void *data) {
  FILE *fp;
  fp=(FILE *) data;
  fwrite(buf,sze,1,stdout);
  return 0;
} 

int main(int argc,char *argv[]) {

  char *dayname="day.ppm";
  char *nightname="night.ppm";
  FILE *fp;

  int yr,mo,dy,hr,mt,sc;

  struct Rplot *rplot=NULL;

  struct FrameBuffer *day=NULL;
  struct FrameBuffer *night=NULL;

  struct FrameBuffer *img=NULL;


  float wdt=400,hgt=400;
  int x,y,px,py,pwdt,phgt;

 
  MapTransform  tfunc;

  float marg[3];

  float *lat=NULL,*lon=NULL;
  float Z;

  int rv,gv,bv;

  yr=2002;
  mo=31;
  dy=26;
  hr=16;
  mt=0;
  sc=0;

  fp=fopen(dayname,"r");
  if (fp==NULL) {
    fprintf(stderr,"File not found.'n");
    exit(-1);
  }

  day=FrameBufferLoadPPM(fp,dayname);

  if (day==NULL) {
    fprintf(stderr,"Error loading image map.'n");
    exit(-1);
  }
  fclose(fp);


  fp=fopen(nightname,"r");
  if (fp==NULL) {
    fprintf(stderr,"File not found.'n");
    exit(-1);
  }

  night=FrameBufferLoadPPM(fp,nightname);

  if (night==NULL) {
    fprintf(stderr,"Error loading image map.'n");
    exit(-1);
  }
  fclose(fp);

  img=FrameBufferMake("dummy",wdt,hgt,24);

  marg[0]=90.0;
  marg[1]=0.0;
  marg[2]=1.0;

  tfunc=MapOrthographic;


  GeoMap(wdt,hgt,tfunc,marg,&lat,&lon);

  zenith=SZAMap(yr,mo,dy,hr,mt,sc,-90.0,
                   wdt,hgt,0,tfunc,marg);   

  pwdt=day->wdt;
  phgt=day->hgt;

  for (y=0;y<hgt;y++) {
    for (x=0;x<wdt;x++) {
      if (lat[y*(int) wdt+x]<-90) continue;
      Z=zenith[y*(int) wdt+x];

      if (Z>90) Z=(1-(Z-90)/10.0); 
      else Z=1.0;

      if (Z>1.0) Z=1.0;
      if (Z<0) Z=0;


      px=day->wdt*lon[y*(int) wdt+x]/360.0;
      py=day->hgt*(0.5-lat[y*(int) wdt+x]/180.0);

      rv=Z*day->img[py*pwdt+px]+(1-Z)*night->img[py*pwdt+px];
      gv=Z*day->img[pwdt*phgt+py*pwdt+px]+
           (1-Z)*night->img[pwdt*phgt+py*pwdt+px];
      bv=Z*day->img[2*pwdt*phgt+py*pwdt+px]+
           (1-Z)*night->img[2*pwdt*phgt+py*pwdt+px];


      if (rv>255) rv=255;
      if (rv<0) rv=0;

      if (gv>255) gv=255;
      if (gv<0) gv=0;

      if (bv>255) bv=255;
      if (bv<0) bv=0;

      img->img[y*(int) wdt+x]=rv;
      img->img[(int) (wdt*hgt)+y*(int) wdt+x]=gv;
      img->img[(int) (2*wdt*hgt)+y*(int) wdt+x]=bv;

    }
  }

  rplot=RplotMake();
  RplotSetText(rplot,stream,stdout);
  RplotMakeDocument(rplot,"SZAMap","1",wdt,hgt,24);

   
  RplotMakePlot(rplot,"SZAMap",wdt,hgt,24);

  RplotImage(rplot,NULL,img,0x0f,0,0,1);  


  RplotEndPlot(rplot);
  RplotEndDocument(rplot);
  return 0;
}